 Rusteau-1D Help
Results (post-processing)
Observation points
The page shows the values at the observation nodes against time, as Observation Points in HYDRUS-1D (file Obs_Node.out, here OBS_NODE.csv).
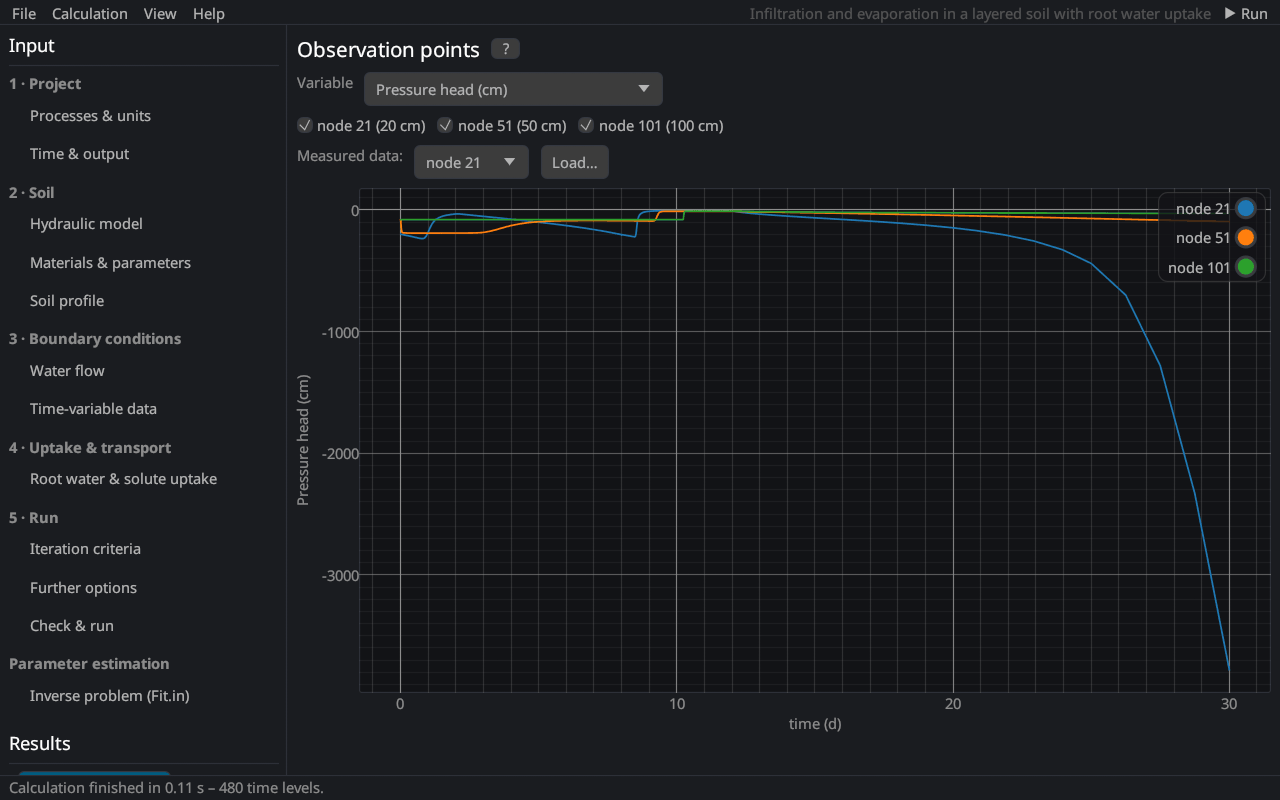
| Control | Description |
|---|---|
| Variable | pressure head, water content, temperature, flux or the concentration of a solute |
| Nodes | check boxes of the observation nodes with their depths |
| Measured data | Load… adds measured values (time, value) of the chosen observation node as points (measured data) |
The observation nodes are defined on the page Soil profile. Resting the mouse on a curve shows the values; drag to pan, Ctrl+scroll to zoom, double-click to reset the axes. Concentrations against time at the bottom node or at depth form breakthrough curves.